Double majoring in Geography and Economics, part of the
research that I do is looking at the spatial distribution of how goods and
services are produced in a given area, and then how they are distributed throughout
their intended markets. An example of this is the Colombian coffee industry. I chose
this particularly industry because over the winter break, I am going on a
school trip to learn about the physical geography of the Nevado del Ruiz area
in the Colombian Andes. This is also the region where a considerably amount of
coffee in Colombia is grown and during the trip, we will be visiting such a
plantation.
The intended audience of this map, assuming that it is
capable of reaching such an audience, would be anyone who is interested in
Coffee production in Colombia. While such a map has been done for individual
municipalities, it has not been done on a departmental basis. Nor is there a
map that shows the global distribution of where Colombian Coffee is exported.
The map that I envision would present the country of
Colombia as a graduated symbol map using appropriately scaled bags of coffee showing the amount of coffee produced in each
first order civil division. In addition, graduated flow arrows will point off
screen showing which countries are the destinations of the coffee. Finally,
there will be a small inset box in one of the corners showing the full extent
of those arrows on a map of the world. The scope of the map would show the
country of Colombia along with the borders of its neighboring countries. The
inset map would show the entire world, though at an obviously smaller scale.
The source of the data will be authoritative data from the Federación
Nacional de Cafeteros de Colombia, translated as the National Federation of
Coffee Growers of Colombia, an organization that promotes the production and
distribution of Colombian Coffee. Their data which shows area under cultivation
by department, as well exportation destinations by bag (60kg), is current up
through 2012.
To produce this project, the required basemaps will be the first
order administrative boundaries for Colombia, the country boundaries for the neighboring
countries, location of major ports, and a country boundary map of the world. First,
these basemaps, found in shapefile format, will be downloaded accordingly and layered
together accordingly in ArcMap. They will then be exported in Adobe Illustrator
format. Taking the data, I will organize the data by increasing order and
derive a classification scheme for cultivation area and export totals. Then I
will produce a graduated color ramp for the cultivation area, and graduated
flow arrows for the export totals. These arrows will point off screen towards
the destination region. In the inset world map, the arrows will be replicated
and the destination countries will be classified accordingly.
The challenges I perceive will be the scope of how far I
want to take this project. The final result will depend on how much time I am
willing to invest in its completion particularly concerning how large a scale I can devote time and effort into producing. A second challenge will be the
incorporation of artistic elements in the map space. Thirdly, how many features
should I include that are only somewhat related to the topic such as mountains
ranges and urban areas.
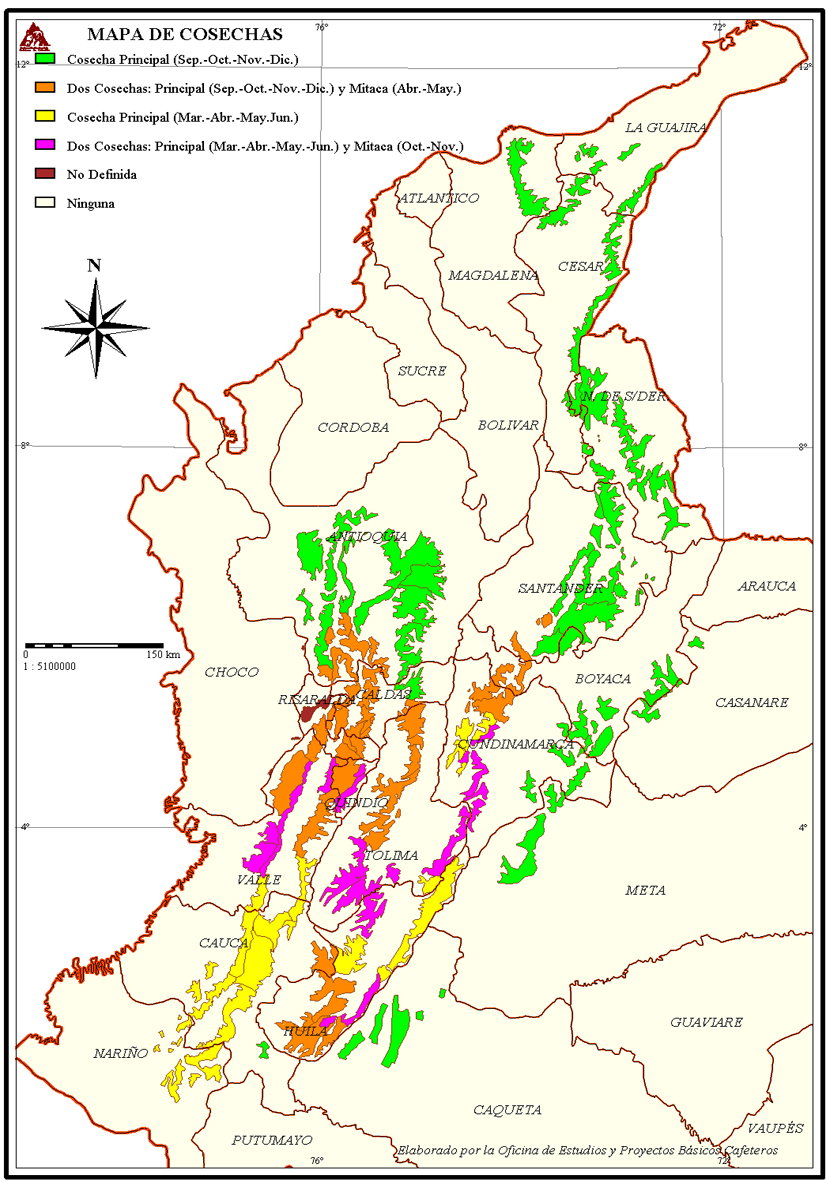
Inspiration Maps
This map shows the harvest periods of Coffee throughout Colombia.
And this map shows international trade of US coal using graduated flow arrows.