
Tuesday, December 10, 2013
Thursday, November 28, 2013

Sunday, November 24, 2013
SuperTyphoon Haiyan Map Example
 |
| Source: http://www.un.org/apps/news/story.asp/html/realfile/story.asp?NewsID=46448&Cr=Philippines&Cr1= |
Bivariate Map Example
 | ||
| Source: http://www.cartographicperspectives.org/index.php/journal/article/view/cp74-perdue/html |
Sunday, November 17, 2013

Sunday, November 10, 2013

Tuesday, November 5, 2013
Final Project Proposal
Double majoring in Geography and Economics, part of the
research that I do is looking at the spatial distribution of how goods and
services are produced in a given area, and then how they are distributed throughout
their intended markets. An example of this is the Colombian coffee industry. I chose
this particularly industry because over the winter break, I am going on a
school trip to learn about the physical geography of the Nevado del Ruiz area
in the Colombian Andes. This is also the region where a considerably amount of
coffee in Colombia is grown and during the trip, we will be visiting such a
plantation.
The intended audience of this map, assuming that it is
capable of reaching such an audience, would be anyone who is interested in
Coffee production in Colombia. While such a map has been done for individual
municipalities, it has not been done on a departmental basis. Nor is there a
map that shows the global distribution of where Colombian Coffee is exported.
The map that I envision would present the country of
Colombia as a graduated symbol map using appropriately scaled bags of coffee showing the amount of coffee produced in each
first order civil division. In addition, graduated flow arrows will point off
screen showing which countries are the destinations of the coffee. Finally,
there will be a small inset box in one of the corners showing the full extent
of those arrows on a map of the world. The scope of the map would show the
country of Colombia along with the borders of its neighboring countries. The
inset map would show the entire world, though at an obviously smaller scale.
The source of the data will be authoritative data from the Federación
Nacional de Cafeteros de Colombia, translated as the National Federation of
Coffee Growers of Colombia, an organization that promotes the production and
distribution of Colombian Coffee. Their data which shows area under cultivation
by department, as well exportation destinations by bag (60kg), is current up
through 2012.
To produce this project, the required basemaps will be the first
order administrative boundaries for Colombia, the country boundaries for the neighboring
countries, location of major ports, and a country boundary map of the world. First,
these basemaps, found in shapefile format, will be downloaded accordingly and layered
together accordingly in ArcMap. They will then be exported in Adobe Illustrator
format. Taking the data, I will organize the data by increasing order and
derive a classification scheme for cultivation area and export totals. Then I
will produce a graduated color ramp for the cultivation area, and graduated
flow arrows for the export totals. These arrows will point off screen towards
the destination region. In the inset world map, the arrows will be replicated
and the destination countries will be classified accordingly.
The challenges I perceive will be the scope of how far I
want to take this project. The final result will depend on how much time I am
willing to invest in its completion particularly concerning how large a scale I can devote time and effort into producing. A second challenge will be the
incorporation of artistic elements in the map space. Thirdly, how many features
should I include that are only somewhat related to the topic such as mountains
ranges and urban areas.
Inspiration Maps
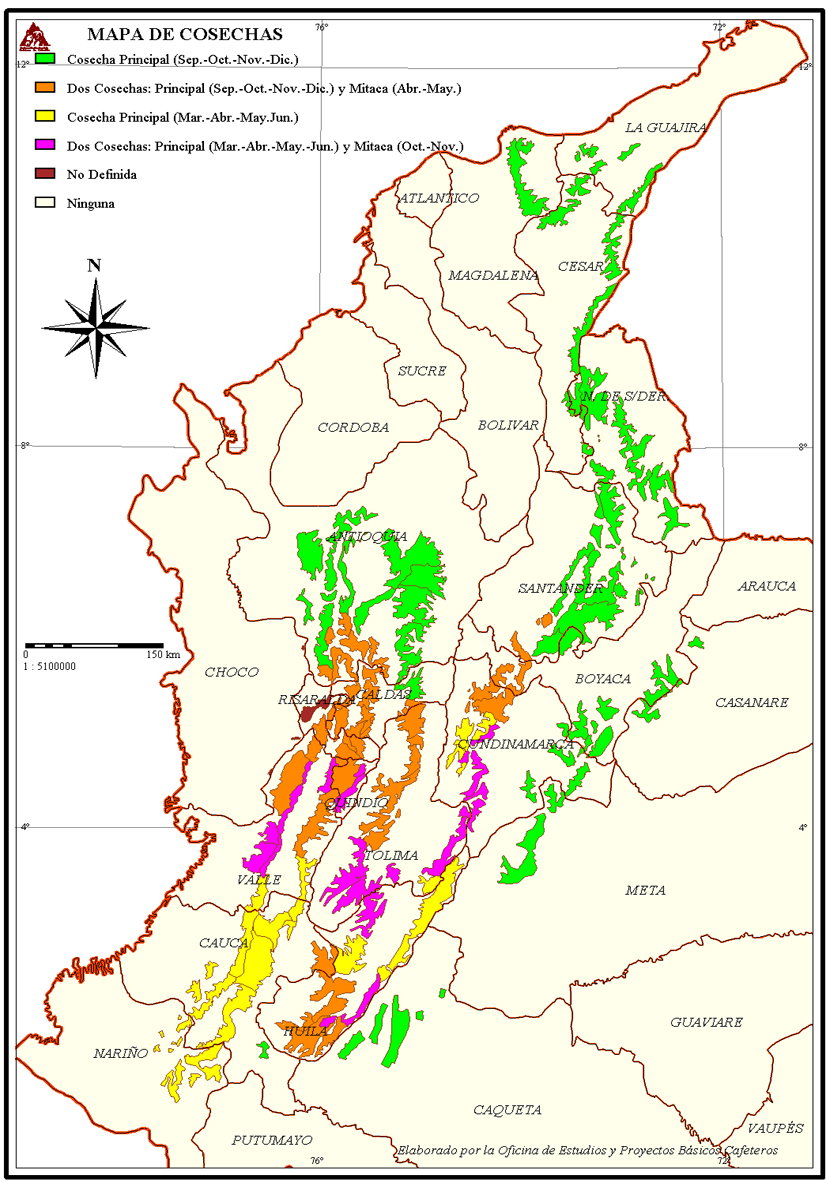
This map shows the harvest periods of Coffee throughout Colombia.

And this map shows international trade of US coal using graduated flow arrows.
Thursday, October 31, 2013
A Dot Density Map
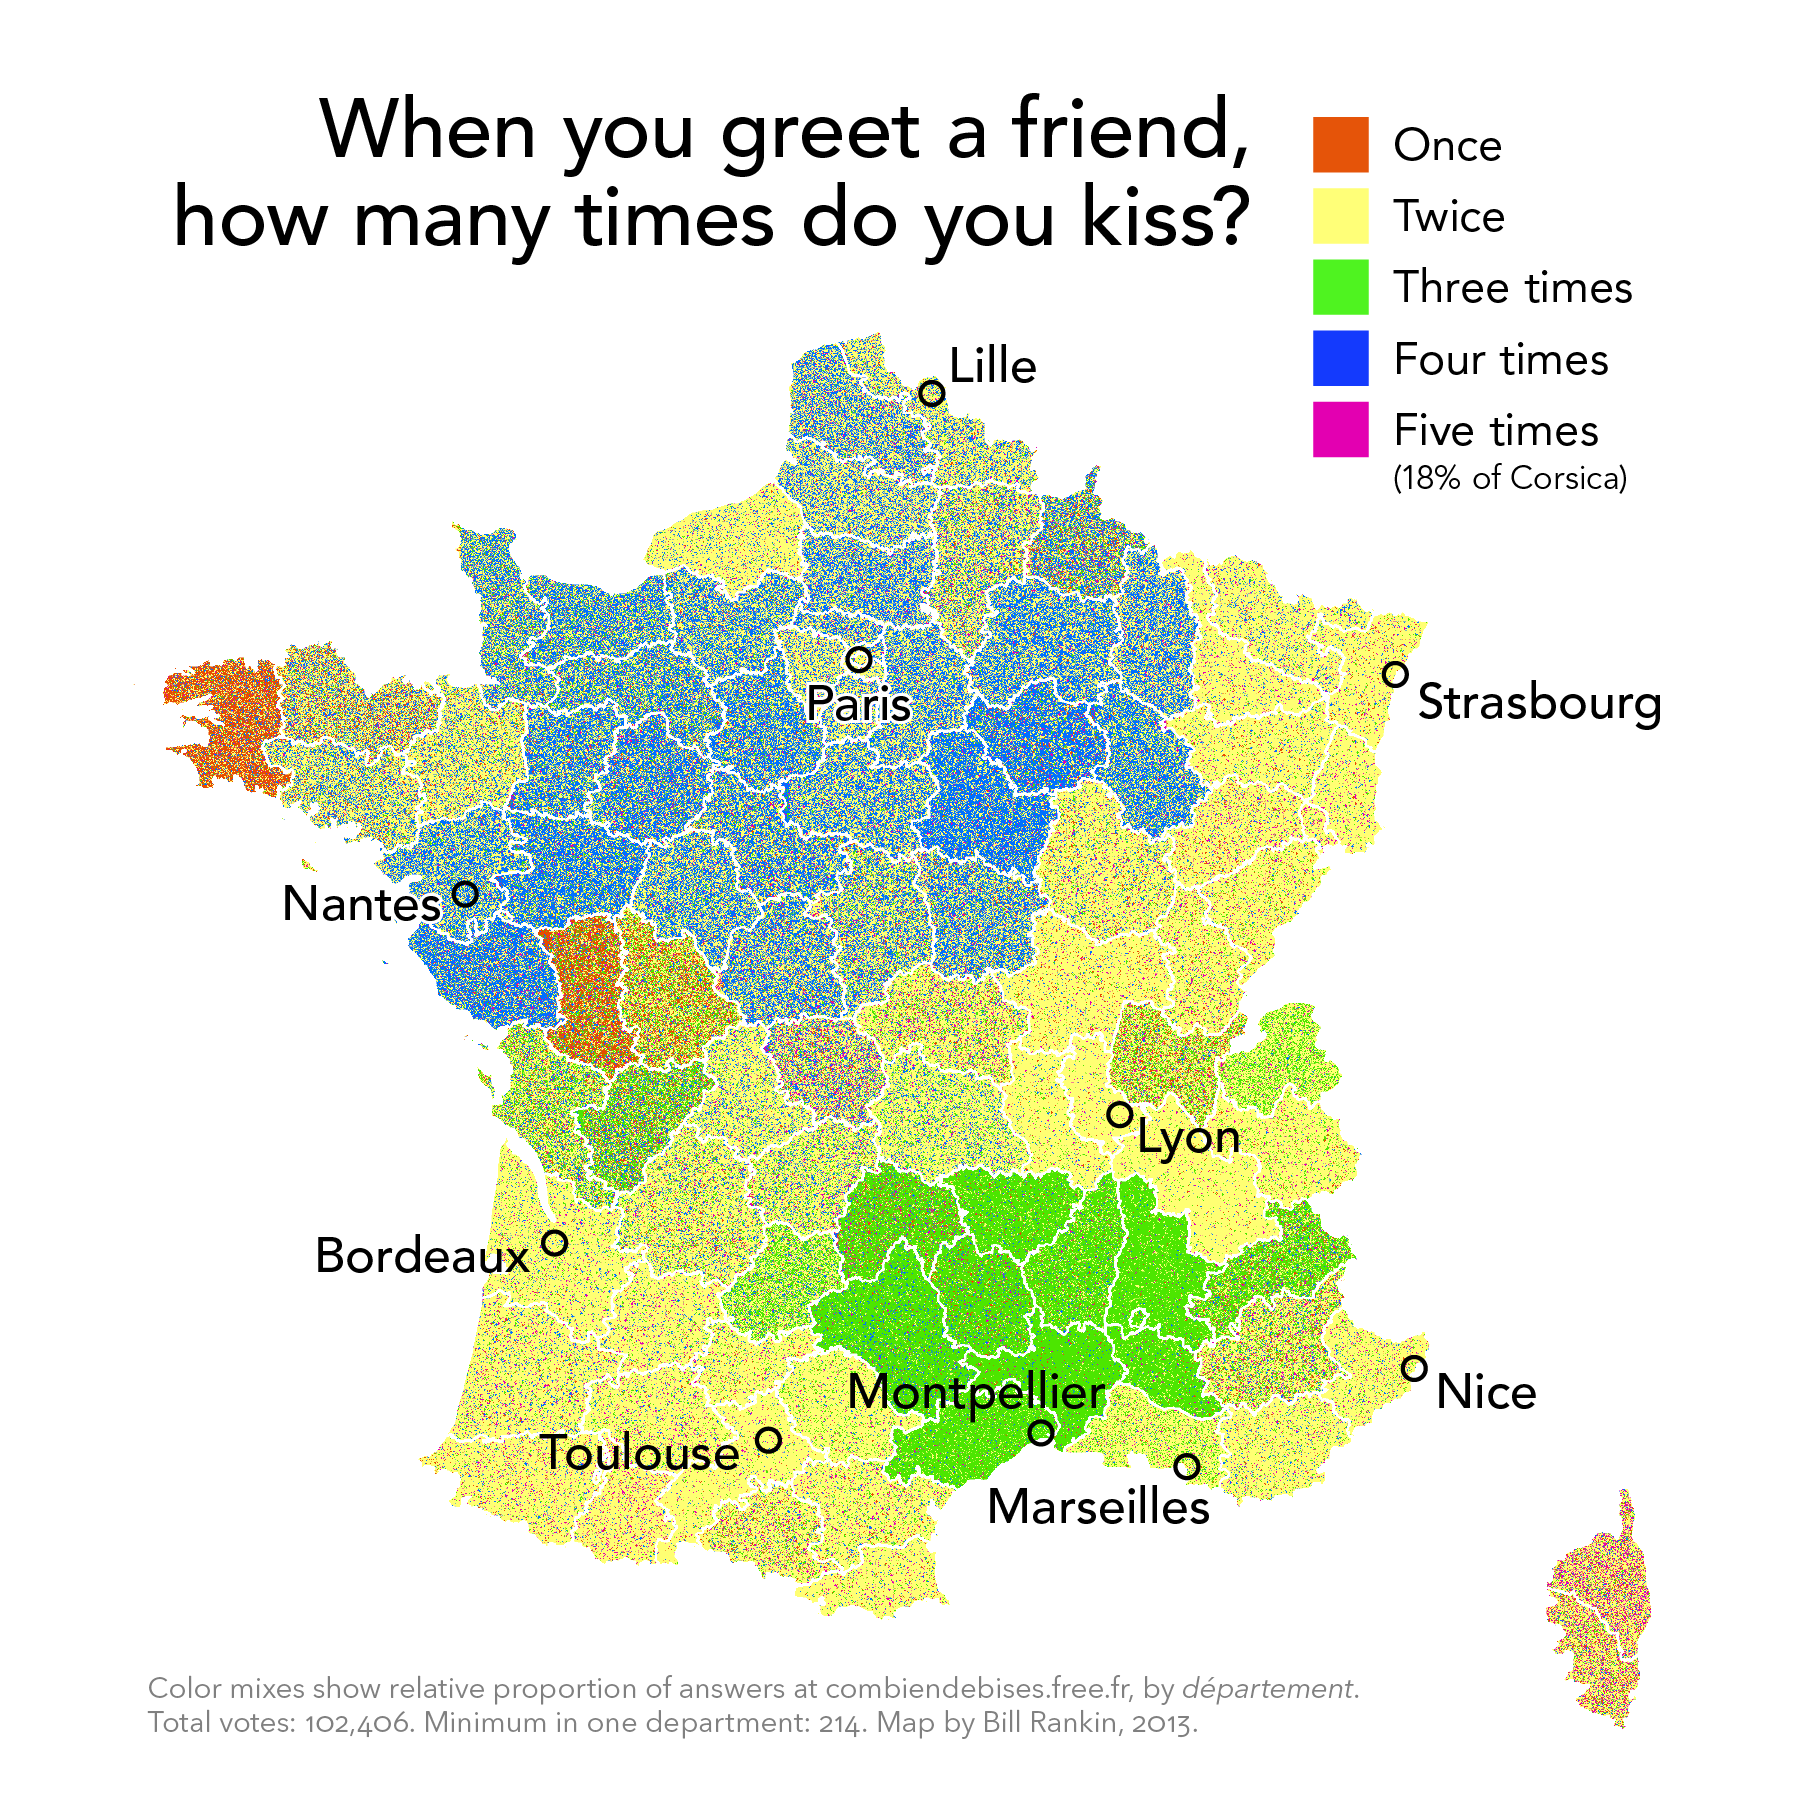
Found here under Browse by Problematic/Social Statistics/French Kissing
Tuesday, October 29, 2013
Isoline Map

Sunshine is an important aspect of life that we don't really take into account. I read an article a while ago about a town in Norway where for a portion of the year, the mountains completely block the sun from hitting the town. So an artist got up on the the hill and built a giant mirror so that the town square would have some sunlight. Interesting parts about this map are that the band of light blue that goes across from northern France through Slovakia. Now it gets me thinking, what factors influence the level of sunlight in a given area?
Friday, October 25, 2013

Friday, October 18, 2013

Wednesday, October 16, 2013
Lab Six

Thursday, October 10, 2013
Using Color in Maps
It may not seem like a thematic map, and it's not. But if you look closely, you can see all the colors of the map. Isn't it artistic~

http://mattcusick.com/paintings-collage/map-works/view/222

http://mattcusick.com/paintings-collage/map-works/view/222
Monday, October 7, 2013
Lab Five
 |
| Natural Breaks |
 |
| Quantiles |
Explanation of differences
Between the two data classification schemes, there is a difference
in the choroplethic qualities found in the maps. In both maps, the
concentration of higher value classes spreads out radially from one region of
the country. But in the map that uses quantiles to classify its data, the
standard distance as a measure of spatial variability is less than the map that
uses natural breaks. The natural breaks map has a smoother transition from high
value classes to low value classes.
Wednesday, October 2, 2013
A Happy Choropleth Map

Happiness in the western states while sadness in the southern states. Must be the nice weather :) While the map doesn't show it by county, I remember a NY Times article doing the same thing and Buchanan County, VA is the saddest place in the United States. I'm mentioning this because I went there for a month on a Habitat for Humanity trip many years ago and can confirm the levels of sadness found there. But on a more seriousness note, we're used to seeing demographic and economic data being put on maps, why not psychological data as well?
Monday, September 30, 2013

Saturday, September 21, 2013

Tuesday, September 17, 2013
An Example of Good Typeface

You really have to see the full size version here. The font and typeface used here in this fantasy map are really well done. The colors and the placement of the typeface adds a lot to the atmospheric qualities of the map. I feel like it's a good example of font used to immerse the viewer into the world that the map is portraying.
For more information
Tuesday, September 10, 2013

Monday, September 9, 2013

Thursday, September 5, 2013
Do you know about the Waterman?
One of the more interesting projections I think is the Waterman Butterfly projection. Some map projections use interruptions to reduce distortion in important regions. The Waterman Butterfly takes it to the extreme! The methodology behind the construction of this projection was to place the globe onto a polyhedron.

I think this is a really interesting projection because it portrays our world to give it a more abstract and philosophical perspective. That we go through our lives having this established conceptual notion that the map is always a rectangle, but then the Waterman Butterfly comes along and challenges that line of thought. It also looks like, as the name suggest, a butterfly.
More information here.
More information here.
Thursday, August 29, 2013
Regional Differences Project
Similar to the project being run at Bostonography on collecting data of what people define each neighborhood in Boston as, the website Regional Differences is doing the same for the entirety of the United States.
When you go to the site, you're prompted to draw the regional boundaries are for what you think each region of the country is called as such as the Corn Belt, Appalachia, Rockies, ect... After you've entered in all the areas you able to, you can submit your selections and see what the rest of the site's users have entered in the amalgamation map. The website is Regional Differences, but if you want to go straight to the results, those are at http://regionaldifferences.com/results.html. The results include the percentage of what region the users thought a specified point in the country was.
I find this site interesting because we all have different opinions of what the different parts of the country are called. Such as what one person might consider the MidWest, another might just think of as the Rust Belt. We always have our textbook definitions of what academics consider the regional boundaries to be, but what do regular people consider the parts of the country to be called? Furthermore, using the data of where respondents considered home, we can derive what each part of the country calls everywhere else.
Here is the link to the Bostonography project.
Subscribe to:
Posts (Atom)