Thursday, October 31, 2013

A Dot Density Map

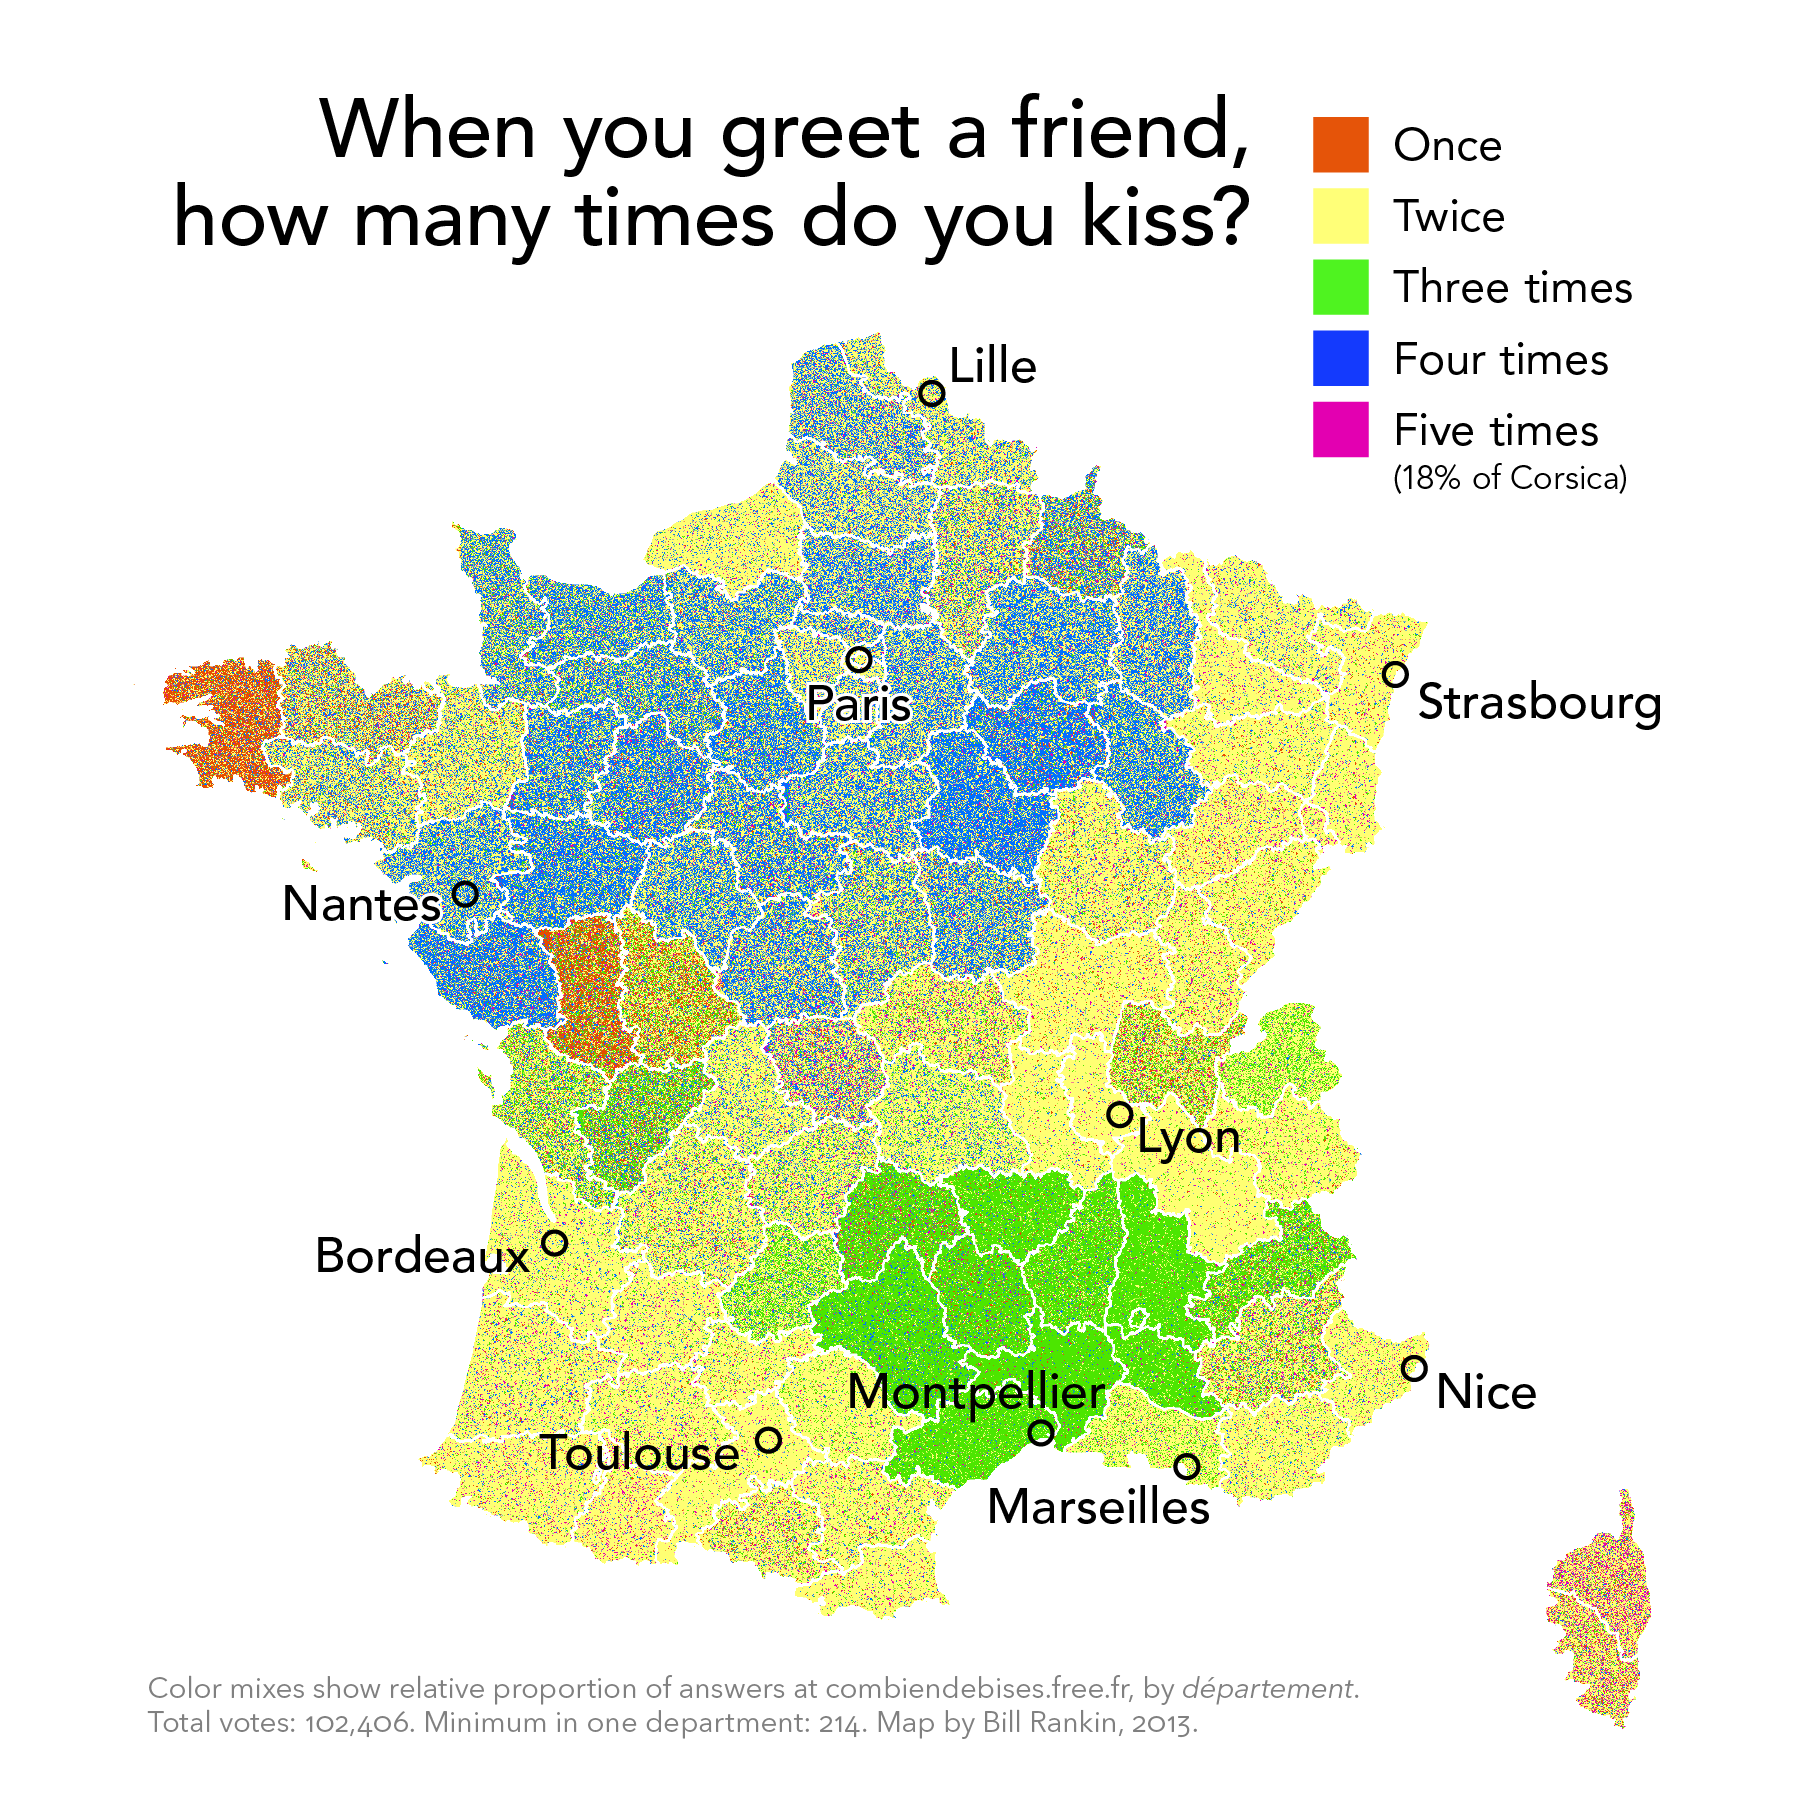
To us Americans, it's a custom that we are not as familiar with. But I like this map for another reason. If you look at it at the higher resolution, you can see how the cartographer used the various classes represented by different colors to paint this portrait of the topic of interest. While it is made up of many individual dots, they all come together to form a more descriptive picture with the variations and blends in color across the map. This is a lot like the impressionist era painting technique of pointillism, which as you would guess, comes from France.

Found here under Browse by Problematic/Social Statistics/French Kissing

Tuesday, October 29, 2013

Isoline Map


Sunshine is an important aspect of life that we don't really take into account. I read an article a while ago about a town in Norway where for a portion of the year, the mountains completely block the sun from hitting the town. So an artist got up on the the hill and built a giant mirror so that the town square would have some sunlight. Interesting parts about this map are that the band of light blue that goes across from northern France through Slovakia. Now it gets me thinking, what factors influence the level of sunlight in a given area?

Friday, October 25, 2013

Wednesday, October 16, 2013

Lab Six

Comparing between the screen and print verisons, there are some differences. The print version is less vibrant, with each of the colors being slightly grayed out. The print version also has a slight pinkish tint to it, as opposed to the screen version that has a slight purplish tint. Of course, because all screens are different and we each have different visual perceptions of color, these interpretation are entirely subjective so your millage may vary.

Thursday, October 10, 2013

Using Color in Maps

It may not seem like a thematic map, and it's not. But if you look closely, you can see all the colors of the map. Isn't it artistic~


http://mattcusick.com/paintings-collage/map-works/view/222

Monday, October 7, 2013

Lab Five

Natural Breaks


Quantiles


Explanation of differences

Between the two data classification schemes, there is a difference in the choroplethic qualities found in the maps. In both maps, the concentration of higher value classes spreads out radially from one region of the country. But in the map that uses quantiles to classify its data, the standard distance as a measure of spatial variability is less than the map that uses natural breaks. The natural breaks map has a smoother transition from high value classes to low value classes.

Wednesday, October 2, 2013

A Happy Choropleth Map


Happiness in the western states while sadness in the southern states. Must be the nice weather :) While the map doesn't show it by county, I remember a NY Times article doing the same thing and Buchanan County, VA is the saddest place in the United States. I'm mentioning this because I went there for a month on a Habitat for Humanity trip many years ago and can confirm the levels of sadness found there. But on a more seriousness note, we're used to seeing demographic and economic data being put on maps, why not psychological data as well?