Tuesday, May 13, 2014
Monday, May 12, 2014
The Big List of Interactive Map Examples
(The link colors dont seem to show up, so the linked text is right under the map example title)
A map that uses option boxes to view different layers
Cambridge, MA Trees in Bloom in April
 This map does a good job of showing the different areas of Cambridge, MA where different flowers are in bloom. It allows you to select type of tree and then displays the density of bloomage (a word?) for each tree for the month. I like it for two reasons, first because flower photography is one of my hobbies, and second because my dad is from Cambridge so I am familiar with the city.
A map that uses moving objects
The Battle of Chickamauga

This map is a good example of demonstrating the use of moving objects across the map. It comes complete with historical narration and action packed movie sequences. Really impressive work.
A map that uses amorphous objects
A map that uses option boxes to view different layers
Cambridge, MA Trees in Bloom in April
A map that uses moving objects
The Battle of Chickamauga
This map is a good example of demonstrating the use of moving objects across the map. It comes complete with historical narration and action packed movie sequences. Really impressive work.
A map that uses amorphous objects
Scientists Warn of Rising Oceans From Polar Melt
This video showcases amorphous objects on a globe projection of Antarctica. I think that one of the more effective parts of this video is the globe projection because it gives the user a better sense of spatial awareness in understanding the relative sizes of the ice depletion as opposed to awkwardly using a polar conical projection.
A map that uses a splash screen
A genetic atlas of human admixture history - UCL and Oxford

While you don't have to click through a introduction sequence, there is still a splash panel to click out of it. Regardless, this map does a great job of explaining the migration origins of various human populations from throughout the world. More impressively, the level of scientific detail used to explain the construction of the map is very fascinating, especially how they included the charts on the side to illustrate the relationships of the different population groups.
A map that uses a neat effect
NYC Solar Map

Now this map is really neat because of its use of interactive geometry to provide user friendliness to an important topic of renewable energy. You can either select individual buildings or create a polygon area and the application will calculate the potential energy that can be generated and trees saved using solar power generation installed on rooftops. The map claims that it can also be viewed from a 3D perspective, however I haven't been able to "unlock" this feature.
A 3D Map
3D Maps Reveal a Lead-Laced Ocean - Science Mag

This map and the accompanying video are cool because the designers effectively use 3D. In doing so, they are able to demonstrate the physics of ocean currents given the undersea topography. Most people think that the ocean is a flat barren expanse, but in reality it is incredibly rugged. By using a 3D perspective, the authors allow greater spatial awareness for the user to help illustrate their scientific findings.
Interesting Map
http://middle-earth.thehobbit.com/map

The title says it all. If only they had a version for the entirety of Middle Earth, and perhaps even Beleriand from the Silmarillion as well.
While you don't have to click through a introduction sequence, there is still a splash panel to click out of it. Regardless, this map does a great job of explaining the migration origins of various human populations from throughout the world. More impressively, the level of scientific detail used to explain the construction of the map is very fascinating, especially how they included the charts on the side to illustrate the relationships of the different population groups.
A map that uses a neat effect
NYC Solar Map
Now this map is really neat because of its use of interactive geometry to provide user friendliness to an important topic of renewable energy. You can either select individual buildings or create a polygon area and the application will calculate the potential energy that can be generated and trees saved using solar power generation installed on rooftops. The map claims that it can also be viewed from a 3D perspective, however I haven't been able to "unlock" this feature.
A 3D Map
3D Maps Reveal a Lead-Laced Ocean - Science Mag

Interesting Map
http://middle-earth.thehobbit.com/map
The title says it all. If only they had a version for the entirety of Middle Earth, and perhaps even Beleriand from the Silmarillion as well.
Sunday, April 27, 2014
Lab Ten
The link to my .html file
For this lab, I wanted to show the different economic areas of mainland China including Hong Kong and Macau. The programming was not particularly difficult, although tedious at first. I like html, and had there been more time, I would have done a more elaborate job. But for the purposes of this lab I think this is enough. The Google Maps Styler didn't have that many options though which left me disappointed. I was hoping for more GIS shapefile type options and such.
For this lab, I wanted to show the different economic areas of mainland China including Hong Kong and Macau. The programming was not particularly difficult, although tedious at first. I like html, and had there been more time, I would have done a more elaborate job. But for the purposes of this lab I think this is enough. The Google Maps Styler didn't have that many options though which left me disappointed. I was hoping for more GIS shapefile type options and such.
Monday, April 14, 2014
Lab Nine
Google Earth Map and Photo Overlay
For Parts One and Two, I used Google Earth to overlay a map drawn in 1913 of the Harbor area of Genoa, Italy. In addition I included a panoramic photo of the harbor as it is in the present day. It's interesting to see the difference that 100 years has made.
Lab Nine .kml Download Link
Google Tour Builder
For Part Three, I depicted the first leg of the Canadian rock band Rush's Clockwork Angels tour. The 2012 tour took the band across over 25 American cities and through five Canadian cities. Google Earth Rush Clockwork Angels Tour
Tuesday, April 1, 2014
Final Project Proposal
As we're aware from the fall, my studies involve the combination and interaction of Geography and Economics, of which I am most interested in Economic Growth and Development. A critical component in understanding and developing policy for economic development involves the use of numbers and statistics. However as Morten Jerven in his book Poor Numbers (2013) describes, there is a prevalent mismatch in how the various statistical agencies of African countries conduct their data collection. That is to say, they each have different parametrics and take into account different variables when formulating key economic indicators such as per capita GDP. This issue extends into international institutions such as The World Bank, as the indexes put out by the various institutions will return different results. For example as Jerven describes, “The World Bank ranks Mozambique as the eighth poorest country, while Madison places it among the twelve richest economics” (p. 19).
This said, for my final project in Advanced Digital Cartography, I am interested in visually illustrating the differences that the three development indexes put out by Madison, The World Bank, and the Penn World Tables. Because the topic is geographical in nature, concerning sub-Saharan Africa, the use of an interactive map would be appropriate. This map would enable the user to see the differences that each institution’s data set depicts of the economic health of the sub-Saharan region.
For the technical specifics of the interactive map there will be several features involving the use of the ArcGIS, Adobe Illustrator, and Adobe Flash software. Among them will be a splash screen to serve as an introduction, as we made in Lab Seven, which will give the audience a brief overview of the topic and additional information from Jerven’s book. Following that, the audience will then be able to move onto the main feature which is the map of Africa alongside three buttons, such as we made in Lab Four, that will toggle a visualization of the rankings given by each institution. This visualization will appear in the form of a Choropleth based on the per capita GDP of each of the 45 countries as they appear in the table found in Poor Numbers. Initially the country’s names will not be labeled, however as the user moves their cursor over the boundaries of the country, the name will then appear. Additionally if the user then clicks on the country, information about the country as described by the CIA World Fact Book as well as a time series chart showing the growth (or decline) of per capita GDP as described by the International Monetary Fund (IMF) will appear in a side bar.
My production schedule for this project would be to first organize the data in a spreadsheet, then to locate a high quality base map. After which will be to design and produce the introductory splash screen, and then to start working on the coding and the translation of the data from the spreadsheet to the actual map. The biggest issue I foresee will be the artistic elements of the project. Unfortunately my skills of an artist are rather limited which is why I hope to initially find a good base map to work off of. Otherwise the coding should be fairly straightforward, however tedious it may be.
Citation
Jerven, M. (2013). Poor numbers: how we are misled by African development statistics and what to do about it. Cornell University Press.
Jerven, M. (2013). Poor numbers: how we are misled by African development statistics and what to do about it. Cornell University Press.
Inspiration
Thursday, March 27, 2014
Thursday, March 20, 2014
Lab Six
This lab was particularly tedious in how precise your shape animation is going to be. It is possible to make a very detailed and precise animation, but that comes at the expense of a considerably more significant time investment. So you have to decide on that before you start the project and dedicate enough time so the endeavor is more feasible.
Thursday, March 6, 2014
Lab Five
In making this map, my biggest issue was trying to find a basemap that I would have more acurately relfected the contemporary boundaries. My other issue was having the various units move across the map as they do on the source map. For lab 6, I would like to change the labels so they have black borders around the text, and to add more cities of note in the map, which may be difficult, considering that the scale of the basemap is not exactly welcoming.
Saturday, March 1, 2014
Sochi 2014 Interactive Graphic
The New York Times has a feature where you can select amongst medal rounds for the various race events to see the time differences between the placings. It's interesting to see how many of the placings have very small time differentials.

Friday, February 28, 2014
Interactive Layers Map Example
An example of an interactive map that uses checkboxes to allow the user to select from a variety of layers to compare between them is the National Geographic Vital Statistics application - part of their Earthpulse program. The site lets users select from a variety of data topics regarding environmental science and human geography. While the map does not allow the user to position layers on top of each other as in a faux-GIS scenario, it does allow the user to switch between the layers through the use of a slider. That way, one can see the relationships between topics such as change in primary forest area and bovine consumption by country. Each data set has additional information on the topic displayed in the panel below the map space.

Tuesday, February 25, 2014
Animated Map Example
The data mapper utility over at the International Monetary Fund (IMF) website allows the user to select from a variety of data sets ranging from real per capita purchasing power adjusted GDP to ATMs per 100,000 population. The available data is then displayed for the countries of the world and the user is then able to select the years of interests as well as play through the years. The chorlopleth elements as well as a line chart showing the data of user selectable countries then change over time as necessary to reflect the data. The website is http://www.imf.org/external/datamapper/
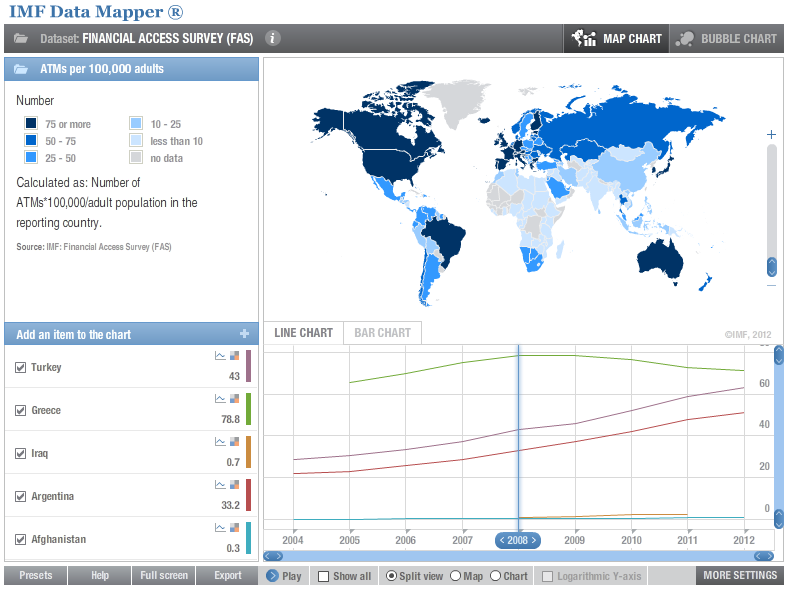
I find this utility interesting primarily because it is related to my field of interest, that being international economic development. Such visualizations make it easier for audiences to understand the data, necessary in the objective of convincing financing organizations and agencies to fund various development projects. It also gives the user a more global understanding of how different regions were affected differently over time.
I find this utility interesting primarily because it is related to my field of interest, that being international economic development. Such visualizations make it easier for audiences to understand the data, necessary in the objective of convincing financing organizations and agencies to fund various development projects. It also gives the user a more global understanding of how different regions were affected differently over time.
Saturday, February 22, 2014
Wednesday, February 19, 2014
Lab Three (an attempt)
After roughly six hours and continuously having issues with getting the stop(); function to work, there was only so much that could be done.
Monday, February 10, 2014
Timeline Map Example
I always had a fascination with historical maps, of how the boundaries of nations and States shifted over the course of history. For this week's example map, Timemaps has a plethora of interactive maps displaying the emerging, changing, and disappearing boundaries of the nations of the world. The link I posted goes to the page on Europe, partly because my favorite period in history takes place during the post-Roman world, to see all the different emerging and fragmenting kingdoms that come to fill the void of the Roman Empires.
Thursday, January 30, 2014
Lab One

For my first lab, I produced a map that displays the 2009 Gross Domestic Products (GDP) for each state in the United States. I used a green color ramp because we associate green with money. In hindsight, I should have used GDP per capita instead of total GDP because one, standardized data is more appropriate for a choropleth map, and two, it would have made for a more interesting visualization. The map I made above is easily explained by citing population figures.
Sunday, January 26, 2014
Dynamic Map Example

The map that I found, allows the user to view the different outbreaks of various vaccine-preventable diseases. These outbreaks come in the wake of the 1998 study that erroneously linked the various vaccines to an increased likelihood that the vaccinated individual would develop autism. Here is the link to the interactive map's website.
I find this map interesting because of the various parameters one can set to view the data. These parameters of include disease, region, and time. An example of this would be to look at a measles outbreaks in a region such a Europe. One then can make the observation that while France has a higher total number of outbreaks, the United Kingdom's outbreaks have been more spread out over time. However as the article points out, the data points don't tell the entire story as in Africa, the issue is access to vaccinations in general, not that people are voluntarily declining to be vaccinated. But all very interesting to visualize the data in this way nonetheless.
Here is the link to the NPR article.
Thursday, January 23, 2014
Subscribe to:
Posts (Atom)